CPSC 444 L2B FacilityFinder - Blog Update #6
This blog post will contain details about our pilot test, our experiment abstract, annotated output from our quantitative analysis, and our revised supplementary experiment materials.
6a. Pilot Test
We conducted 2 pilots of the study. Below are the findings and modifications made.
1. Technical issues in survey
- Likert scale had duplicated numbers
- Survey randomised questions instead of blocks
Modifications
- Troubleshooting was conducted.
2. Unclear to participants that there were multiple prototypes.
Modifications
- Modified the script to explicitly inform participants to expect 3 prototypes
- Added text block to experiment survey to remind participants of the 3 prototypes available prior to start of tasks
3. Post-task mini surveys’ qualitative data were insufficient in contextualising participant decisions.
Modifications
- Added justification questions to all Likert/ranking questions.
4. Some unclear prototyped elements/features:
- Current location dot on map
- Iterate-able images in washroom listing
- Confusion over function of ‘Add/Update Washroom’
Modifications
- Changed the color of the location marker to be more visually salient.
- Added a “Next” button to prompt participants during the wayfinding screen
- Separated the “Add” and “Update” functions into two separate screens
5. Prototype limitations caused frustration:
- Drop down menu in ‘add washroom information’ page not being clickable.
Modifications
- Added a selectable function to the drop-down menu so that participants can complete the selection.
6b. Experiment Abstract
Finding an adequate washroom should be simple for everyone, but for members of marginalized communities, this is often not the case. Existing tools often contain out-of-date information, are undermaintained, or are unknown to the general populace. To address this issue, we investigated methods to motivate people to continuously utilize and add information with FacilityFinder, an app prototype centered around democratizing access to information about washroom facilities by allowing people to add and update information for washrooms around UBC. We conducted a within-subjects experiment with 3 degrees of gamification to determine the best method of motivating participants to update information. Though we found no statistical significance between the different conditions, participants reported a preference for some degree of gamification over no gamification at all. Through qualitative analysis, we discovered that external motivations such as the desire to help others played a major role in participants' motivation for adding and updating information.
6c. Annotated Output from Quantitative Analysis
H1 Analysis
Note
1= 'Baseline' condition2= 'Points-Only' condition3= 'Points-and-Achievements' condition
Hypothesis:
- H1: The Points-and-Achievements condition will be the most preferred condition, over the Baseline and Points-Only conditions.
- Null: There is no preference for the Points-and-Achievements condition over the other conditions.
Analysis in R:
# A tibble: 1 × 6
  .y.       n statistic    df     p method
* <chr> <int>     <dbl> <dbl> <dbl> <chr>
1 score     9     0.667     2 0.717 Friedman test
Results:
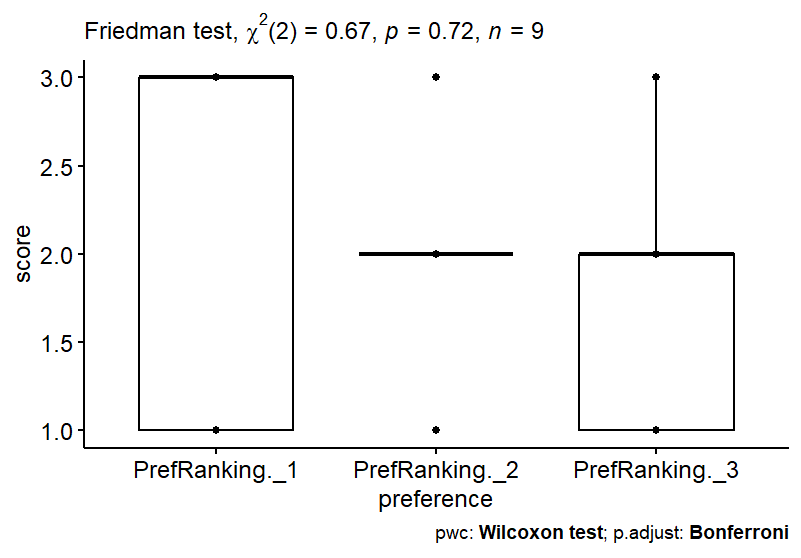
Our first dependent variable in this analysis was the participants’ ranking of prototype preferences. As seen in Figure 1, on average, participants’ first preference was the "Points-and-Achievements" condition prototype. Following this, the averaged \(2^{nd}\) and \(3^{rd}\) preference were both the "Points-Only" condition. However, as illustrated in Figure 1, preference 3 had a larger interquartile range, indicating slightly more variation in participants’ \(3^{rd}\) preference choices.
Upon performing a Friedman test on this data, we found no significant effect (\(χ^2 = 0.667, df = 2, p = 0.717\)) at the \(5\%\) significance level between gamification method and prototype preference. This is confirmed by our Kendall’s W test (see Figure 2) which found a close-to-0 effect size (effect size = \(0.0370\)), indicating poor agreement amongst participants in their rankings.
H2 Analysis
Note
A1= 'Baseline' conditionB1= 'Points-Only' conditionC1= 'Points-and-Achievements' condition
Hypothesis:
- H2: Participants spend the least amount of time exploring in the No-Points condition prototype.
- Null: Participants do not spend the least amount of time exploring in the No-Points condition prototype, compared to the other conditions.
Analysis in R:
Results:
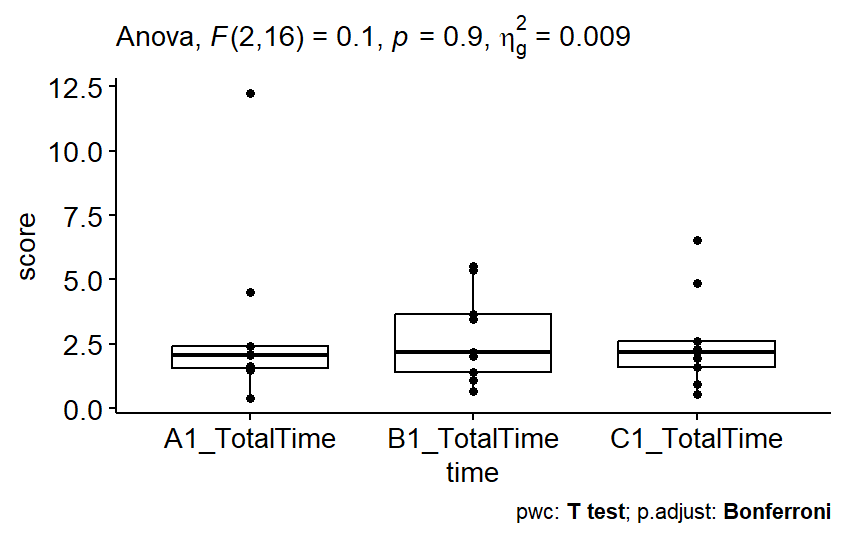
Our second dependent variable in this analysis was the time participants spent exploring each condition’s prototype. As illustrated in Figure 3, on average participants spent the same amount of time on all \(3\) conditions’ prototypes. We performed a one-way repeated measure ANOVA on this data and found no significant effect: (\(F(2, 16) = 0.105, p = 0.901, η^2 = 0.009\)) at the \(5\%\) significance level between gamification method and the total time participants spent exploring the prototype.
H3 Analysis
Hypothesis:
- H3: Participants will be most motivated to add information to washroom listings in the Points-and-Achievements condition.
- Null: There is no significant difference in participant motivation to add washrooms across different conditions
Analysis in R:
Results:
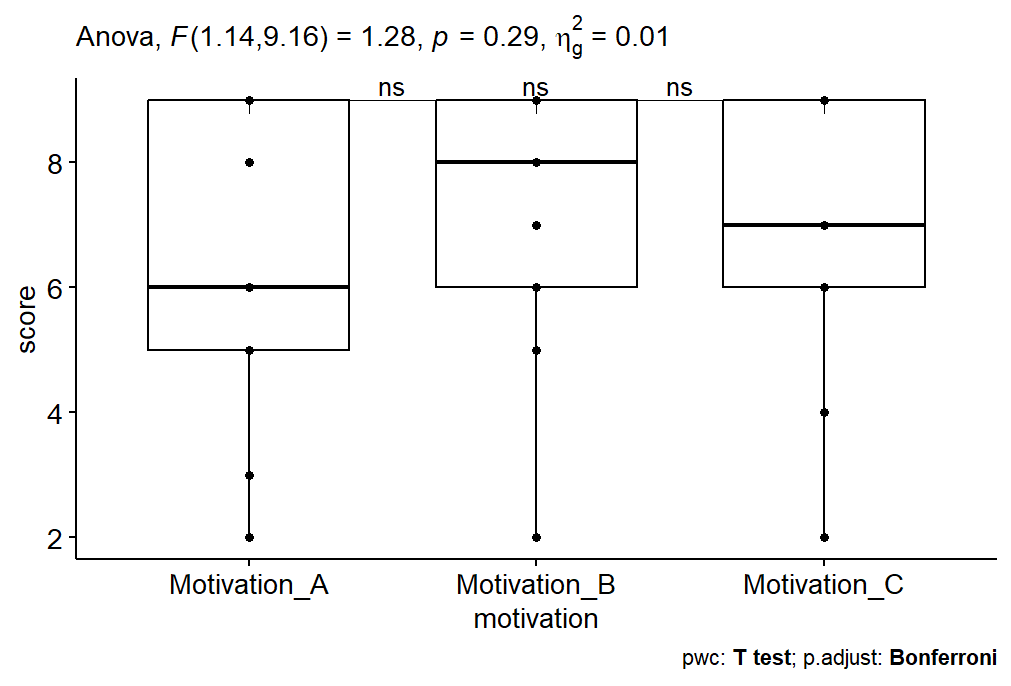
Our final dependent variable in this analysis was how motivated participants felt to add and/or update washroom information. As illustrated in Figure 4, on average, participants reported having highest motivation for condition B (Points-Only), followed by condition C (Points-and-Achievements), then by condition A (Baseline). We performed a one-way repeated measure ANOVA on this data and found a small (\(η^2 = 0.015\)) but not significant effect (\(F(1.14, 9.16) = 1.278, p = 0.29\)) at the \(5\%\) significance level between gamification method and amount of motivation participant felt to add and/or update washroom information.
Other DVs
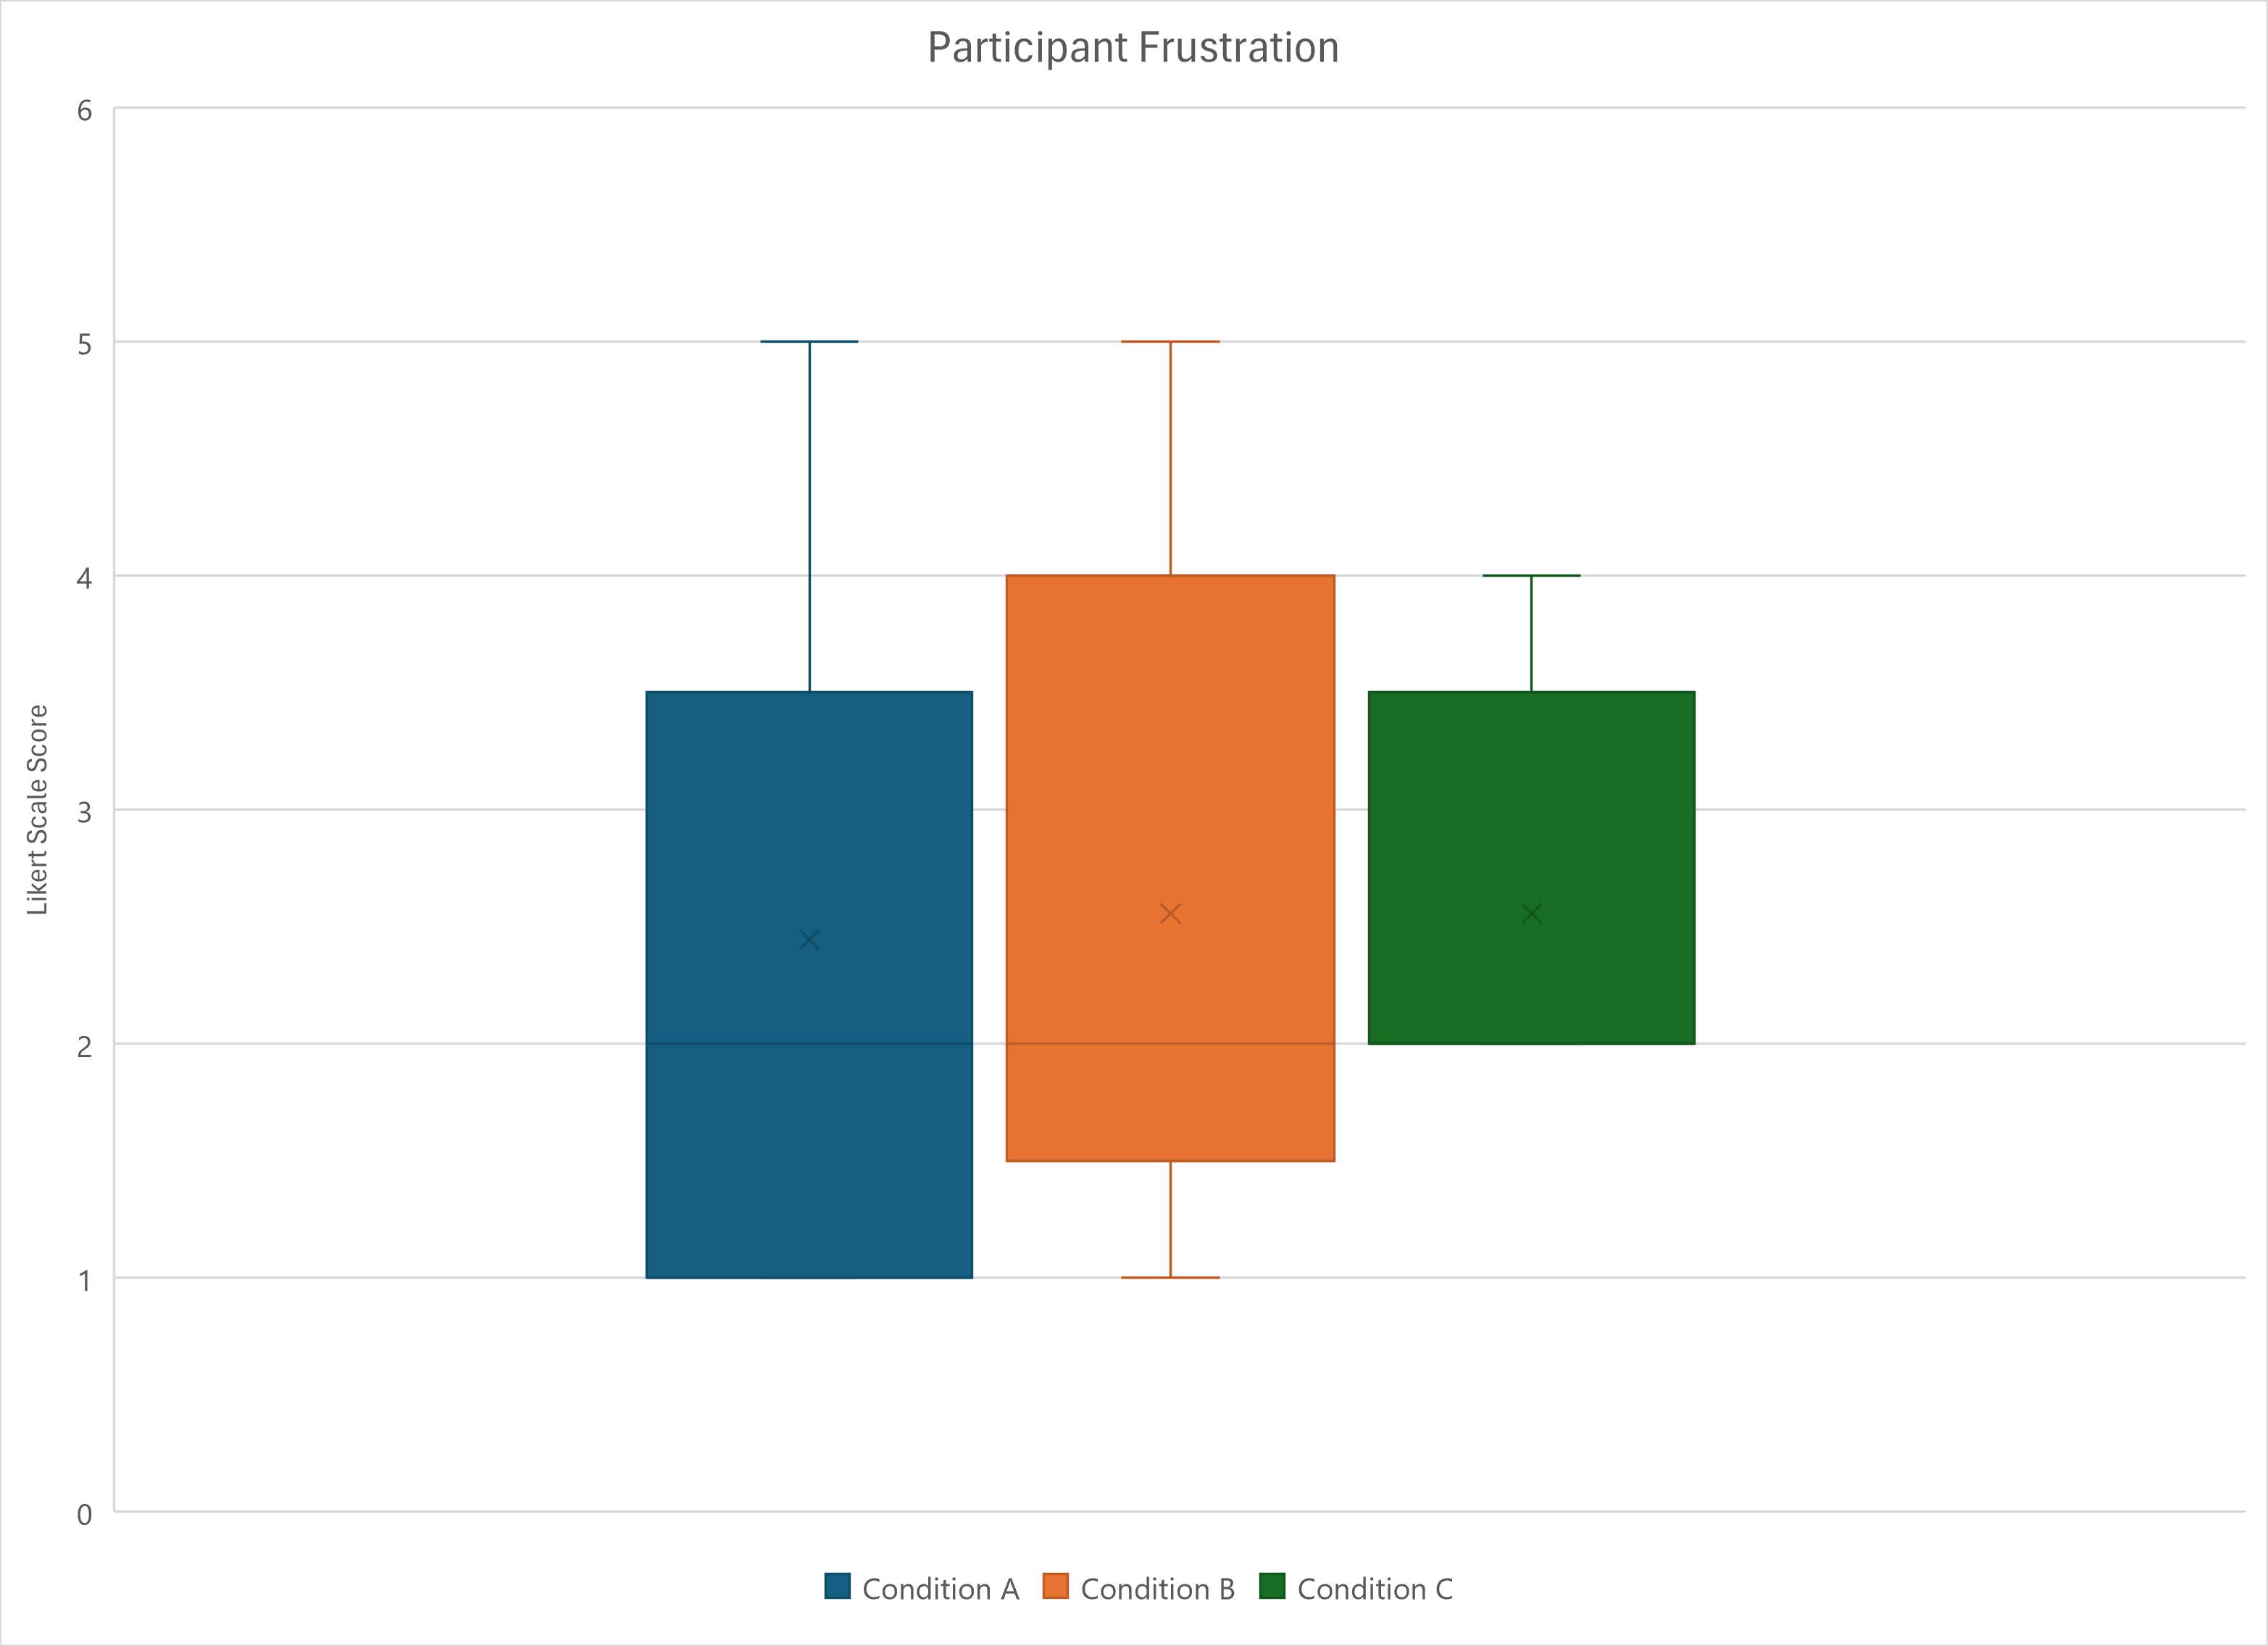
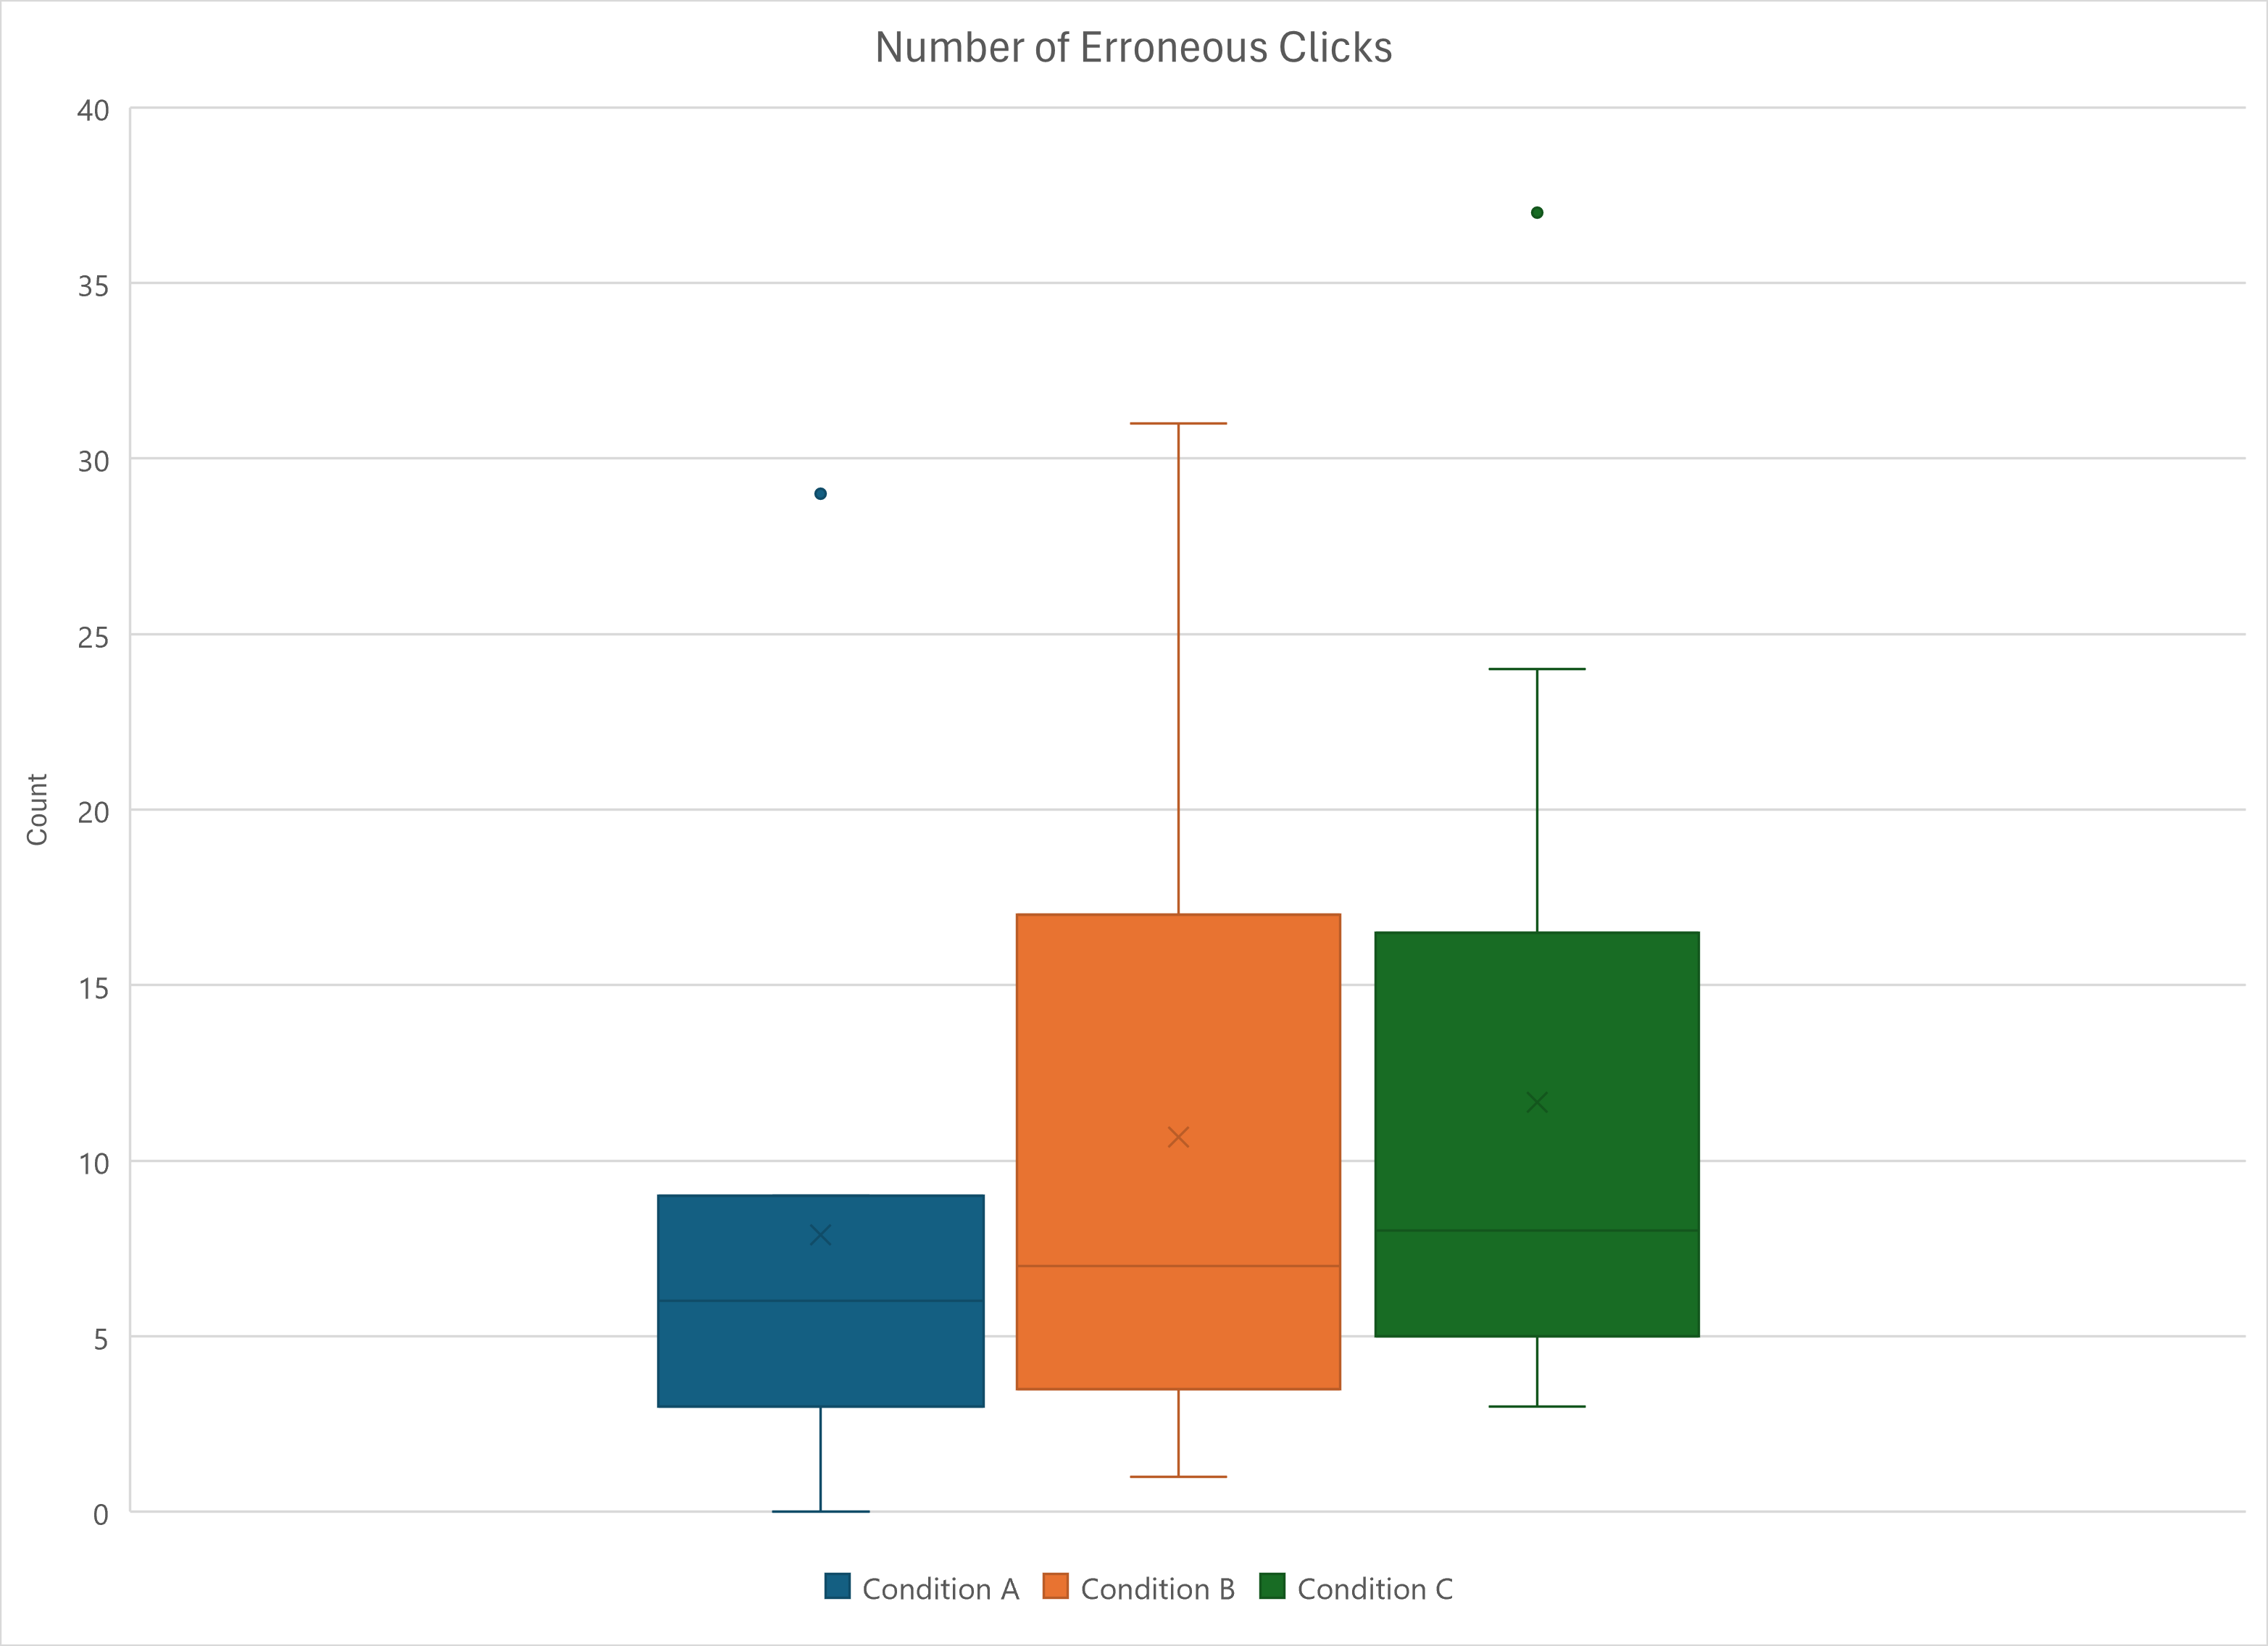
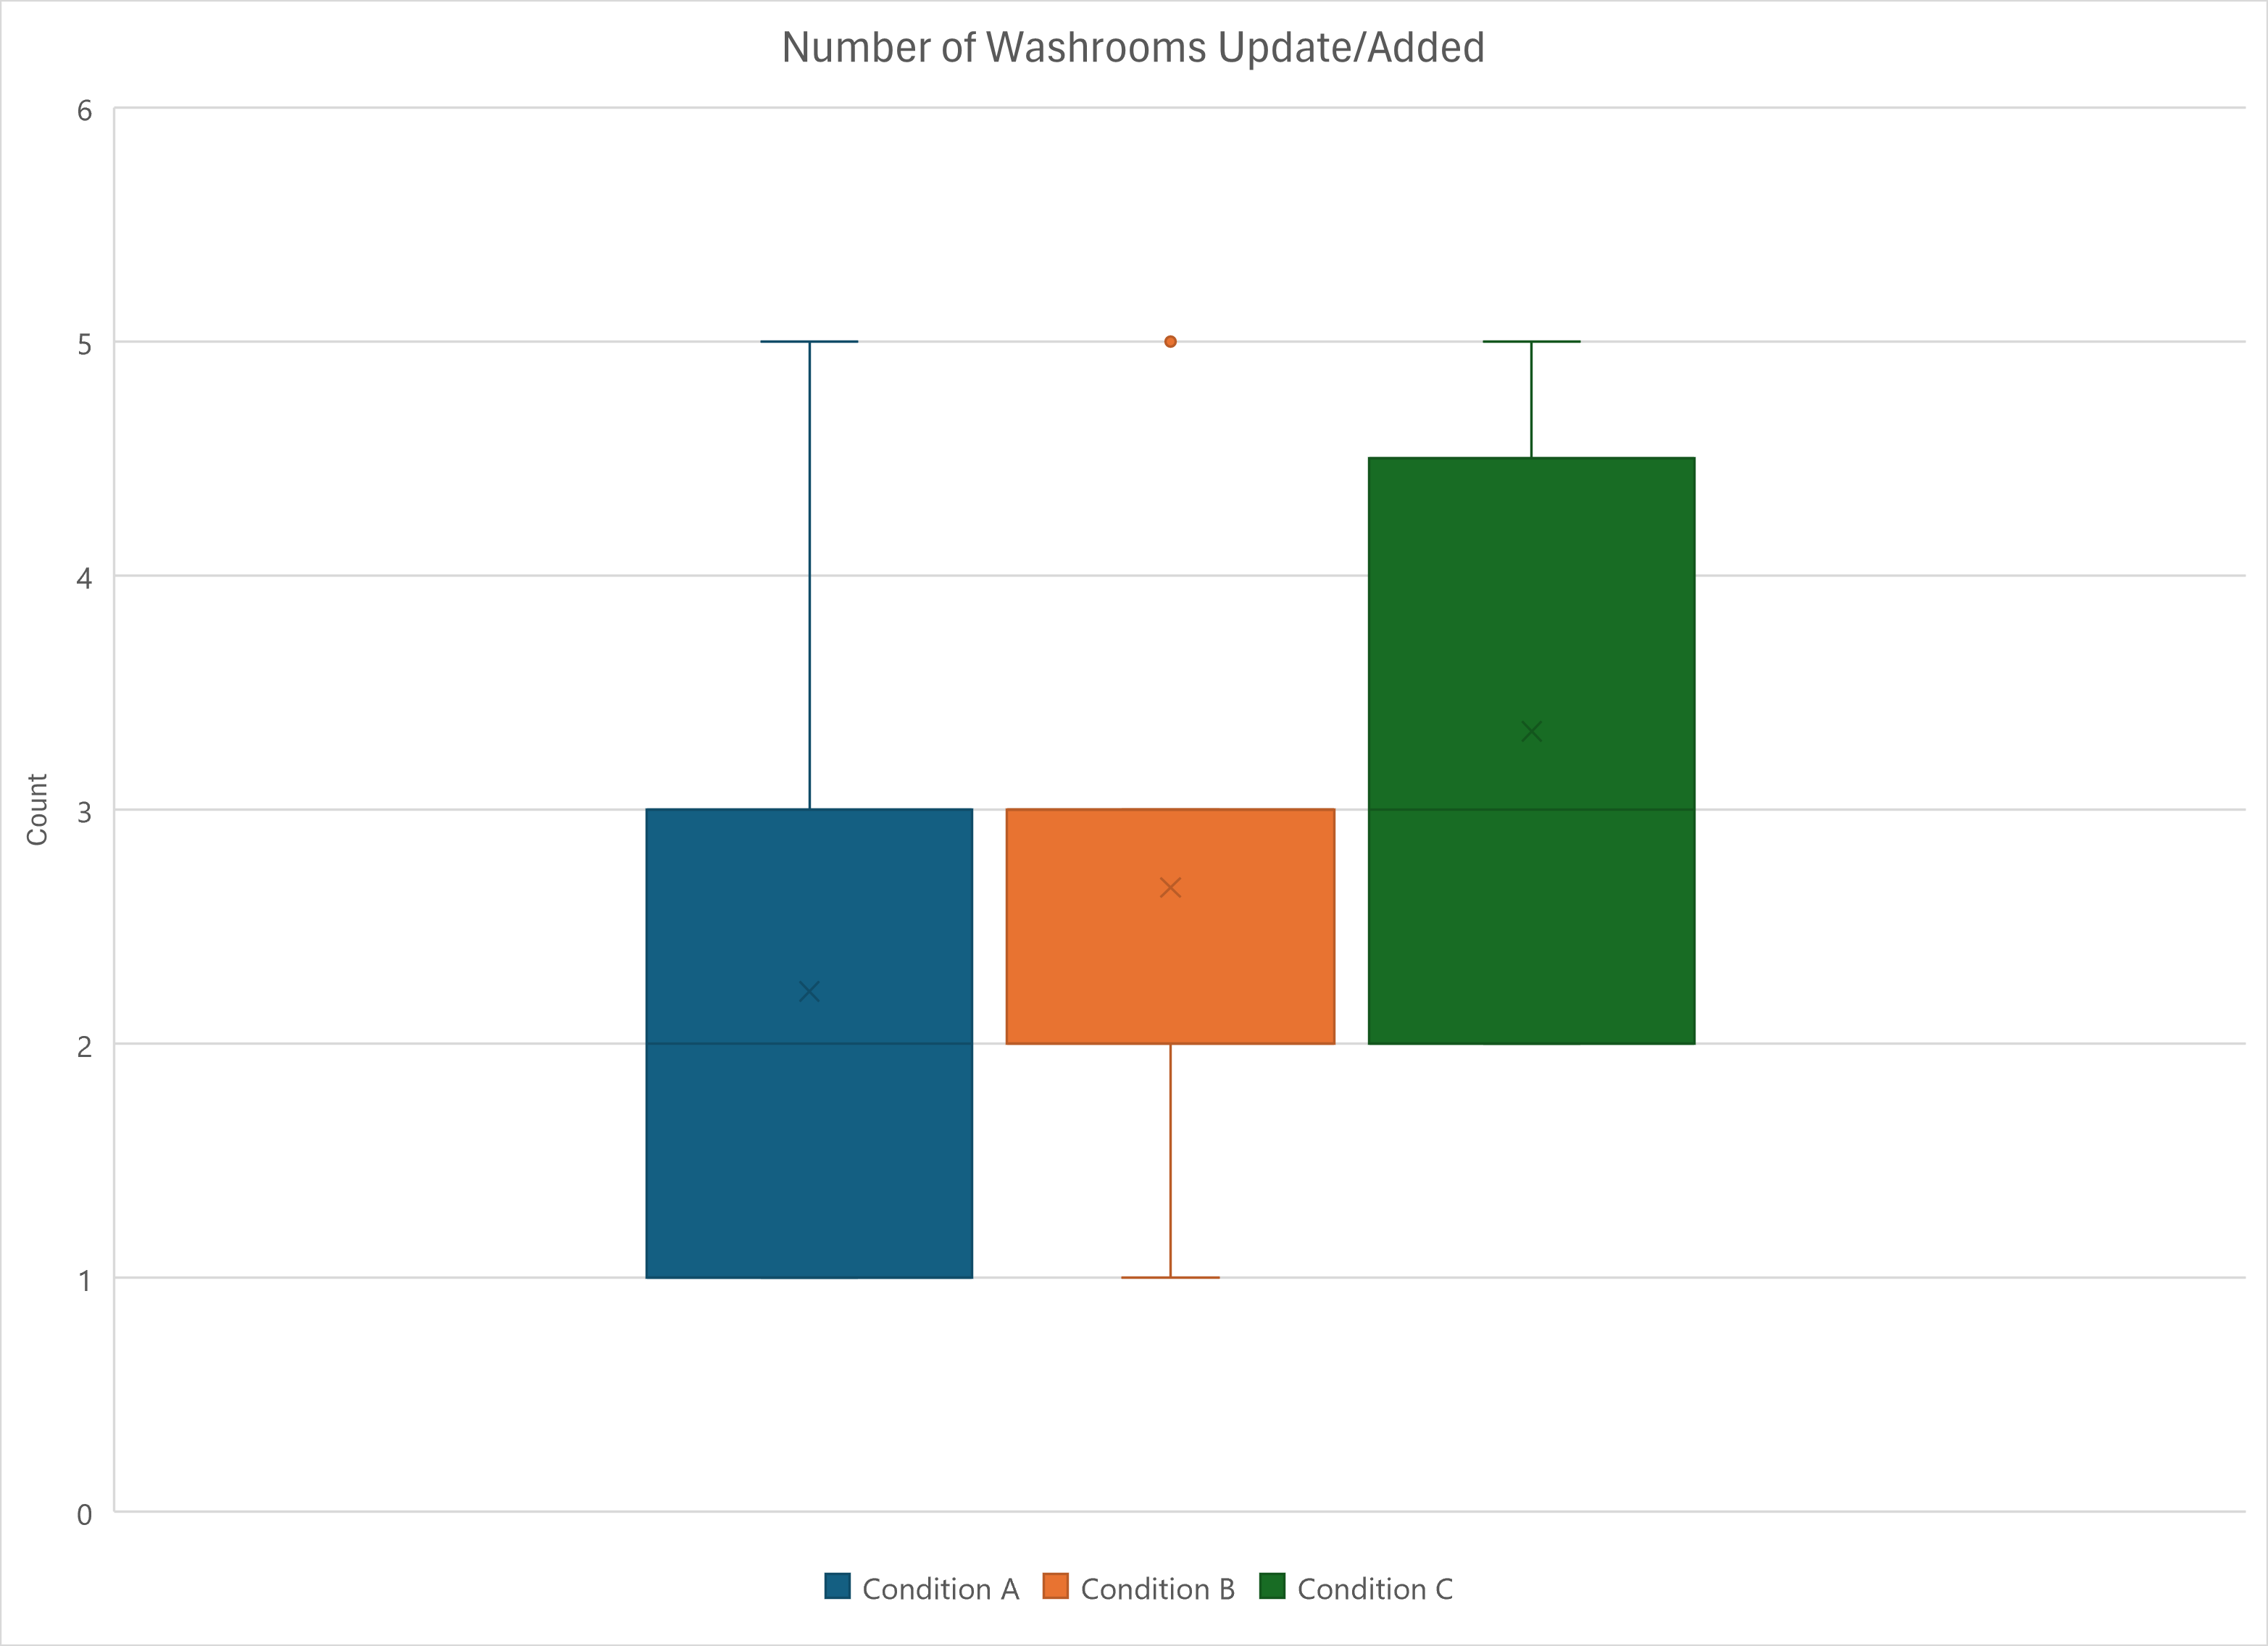
Other secondary dependent variables were participant frustration, erroneous clicks, and number of washrooms added and/or updated by participants. As illustrated by Figure 5, participants reported similar levels of frustration across all conditions.
Additionally, the number of erroneous clicks increased in sequence from condition A to B to C (see Figure 6). The lack of correlation between frustration and erroneous clicks may indicate that they may not have influenced each other too strongly. Further, there does not seem to be a negative correlation between erroneous clicks and frustration.
Lastly, on average, participants were observed to add the most washrooms in condition C, and the least washrooms in condition A (see Figure 7).
Qualitative Data
For triangulation of participant preference (H1):
- 4 participants specifically noted something positive about achievements
- e.g. smiling and nodding at achievement notifications, saying that achievements were ‘cool’
- 2 participants actively noted the loss of achievements in conditions that didn’t have achievements
For triangulation of motivation (H3):
Common reason provided by participants for their motivation to add/update information were:
- Desire to get points and/or achievements (5 participants)
- Desire to maintain accurate information for app users (6 participants)
- Desire to help others (6 participants) and/or their future selves as people who have specific washroom needs (2 participants)
Additionally, 3 participants mention being neutral about the gamification features. This suggests that gamification did not play a large role in their motivations.
Our analysis of our qualitative data also revealed the following:
- Individuals of marginalized identities who required more specific washroom needs exhibited positive reactions to the project. Specifically, 3 participants noted that they or someone they know would benefit form using Facility Finder.
- Participants who have less requirements tend to show more mixed reactions to the app. For instance, 1 participant said that the prototypes were too convoluted. Instead, they would prefer to ask others for directions. 2 participants note that they could see it being used for people new to campus or with more specific needs, but that they personally did not see themselves using it.
- In-building navigation is a desirable feature. 3 participants said that the in-building maps were useful. They noted that other navigation apps tended to neglect the indoor information, leaving them to navigate unfamiliar buildings on their own.
- Potential issues regarding resources like this being exploited. 3 participants noted the ways in which a gamified resource like this could be exploited. For example: adding false information to gain points, intentionally lying to gatekeep good washrooms etc.
6d. Revised Supplementary Experiment Materials
Please find the updated supplementary experiment materials below:
| Material | Link |
|---|---|
| Observation Sheet | download PDF |
| Observation Protocol | download PDF |
| Experiment Script | download PDF |
| Consent Form | download PDF |
| Recruitment Survey Link | ubc.ca1.qualtrics.com/jfe/form/SV_1MottkHPwzHuoS2 |
| Recruitment Survey PDF | download PDF |
| Experiment Survey Link | ubc.ca1.qualtrics.com/jfe/form/SV_1EOKhOf5AgJRiia |
| Experiment Survey PDF | download PDF |
| Baseline Figma | figma.com/proto/... |
| Points-Only Figma | figma.com/proto/... |
| Points-and-Achievements Figma | figma.com/proto/... |
Summary of Changes:
- Observation Sheet: The tables were reorganized to make it easier to fill out during the experiment, such as setting aside areas for each task.
- Observation Protocol: This was a new file created with notes on observation best practices.
- Experiment Script:
- Added a section to inform participants that there are 3 prototypes to test
- Small changes in wording to improve clarity
- Added a link to the experiment survey for easy access during the experiment.
- Consent Form: No changes were made to the consent form.
- Recruitment Survey:
- Survey was updated to include a question about the participant's affiliation with UBC
- Clarified the data entry instructions for name & email
- Clarified the recruitment timeline and estimated time commitment.
- Experiment Survey:
- Updated the survey introduction
- Updated data entry bugs (ex. duplicate numbers on Likert scale, missing text/number labels on scale)
- Updated the wording of some questions for clarity
- Added a note to remind participants of the 3 prototypes available
- Added open ended questions for participants to justify their ranking of the prototypes
- Figmas:
- Figma prototypes were updated to reflect the changes made based on the pilot test feedback.